
From Dates to Dollars: Advanced Cost Modeling in MS Project
1. Introduction: From Dates to Dollars
Microsoft Project is built for scheduling - start dates, durations, dependencies, calendars. But if you stop there, you’re missing half the picture.
What does your plan actually cost? If you make a change, what will that change cost?
This article shows how to turn MS Project into a powerful cost modeling tool. Not just for basic budgets, but for precise, real-time labor and material costing across direct, burdened, and fee-inclusive views. Using Excel and a bit of VBA, you can unlock Project’s hidden cost rate table features, overcome interface limitations, and build dynamic, multi-perspective cost models inside your schedule.
Whether you're pricing a proposal, building a forecast, or reconciling against an EV system, this approach gives you the accuracy and control you need without leaving Project.
2. Why Cost Modeling in Project Often Falls Short
Most people know you can assign a cost to a resource in Microsoft Project.
But here’s what most don’t realize:
You can define multiple cost rate tables (A through E) for each resource
You can use effective dates to model rate changes such as escalation
You can create material resources for non-labor cost modeling
You can switch cost perspectives such as direct, burdened, and fee inside the schedule
Unfortunately, all of this is hidden behind a user interface that:
Limits you to two decimal places for rates
Makes rate table management slow and error-prone
Offers no easy way to toggle between cost views
As a result, most users never go beyond the default. They either do the cost modeling in Excel or struggle with mismatches between their schedule and their budget.
But what exactly are we trying to model more accurately? It's not just hourly rates — it's the full picture of labor and material burdening that defines true project cost. Before we dive into the reconciliation problems this causes, we need to understand how indirect costs actually work.
3. What Are Indirect Costs and How Are They Built
To understand why precision matters in project cost modeling, you first need to understand what goes into a cost rate.
Most users think of a labor rate as “how much we pay someone per hour.” But in professional project environments — especially in government, internal recovery, or commercial proposals — that’s just the starting point.
Real labor cost includes indirect burdens — structured add-ons that reflect the full cost of doing business. These often include:
Fringe benefits (health insurance, paid leave, retirement contributions)
Overhead (supervision, systems, facilities)
General & Administrative (G&A) expenses (corporate infrastructure)
Fee or profit, depending on contract or pricing rules
These burdens are typically calculated as percentages — but what they are calculated on varies:
Fringe is usually a percentage of base salary
Overhead often applies to base + fringe
G&A is commonly calculated on base + fringe + overhead
Fee is then applied to the fully burdened subtotal
So even a simple labor category involves layered calculations, each compounding on the last.
And for non-labor costs — like materials, travel, or subcontractors — the burdening is usually lighter:
Most organizations apply G&A only to materials
Fringe and overhead generally do not apply to material costs
How Are These Percentages Determined?
The percentages used for fringe, overhead, and G&A aren’t arbitrary — they’re typically set by an organization’s finance or accounting department, and often based on:
Historical actuals from internal cost accounting systems
Forward-pricing rate proposals submitted to agencies (for government contractors)
Audited rates approved by agencies like DCAA or internal controllers
Standard cost allocation policies, which define what costs go into each pool (e.g., rent and admin go into overhead, HR and insurance go into fringe)
Each burden pool is divided by an appropriate base (e.g., total direct labor dollars) to produce the burden rate percentage.
For example:
Fringe might be based on HR, benefits, and paid leave costs divided by total labor
Overhead might be based on department operating costs divided by labor charged to projects
G&A usually spreads corporate costs (legal, finance, IT) across the full cost base
Fee is applied per contract, sometimes capped, and typically expressed as a flat percentage of the total burdened cost
The result is a layered rate structure that must be modeled precisely in your schedule if your MS Project file is going to match proposal systems, EV tools, or financial audits.
Why This Matters in MS Project
These indirect structures are often calculated in spreadsheets or cost engines and then summarized for pricing or EVM. But if your MS Project schedule doesn't match the way those systems compute cost, you're going to hit problems:
Your numbers won’t reconcile
Your cost views won’t reflect reality
And your reviewers will lose trust in the schedule as a credible cost model
Before we look at how rounding makes this worse, let’s walk through an example.
4. The Penny Problem and the Reconciliation Trap
In large projects, you often apply burden rates such as overhead, fringe, and G&A, or escalate costs over time. These calculations can result in rates like $52.1745 per hour.
But MS Project only lets you input $52.17. When you multiply that by hundreds or thousands of hours, you end up just a little off. A few cents here, a few dollars there, and suddenly your costs don’t reconcile with your pricing system or cost engine.
We called it the penny problem.
But the real damage wasn’t just the rounding. It was the doubt.
People stopped trusting the numbers. Proposals had to be explained. Cost engineers lost time reconciling data. Reviewers flagged the schedule as unreliable.
Small discrepancies created uncertainty. And in environments where confidence in the baseline is critical, such as pricing reviews, earned value baselines, or audits, that uncertainty undermined everything else.
But rounding isn’t the only reason MS Project cost models become unreliable.
In fact, one of the biggest causes of broken cost logic has nothing to do with rates. It’s how users enter cost data in the first place.
5. The Hidden Risk of Typing Costs Directly Into Tasks
One of the most common mistakes in MS Project cost modeling is this:
Typing a value directly into the Cost column.
It seems harmless. After all, you want to show that a task costs $5,000.
But here’s the problem. Entering a value directly into the Cost field does not apply a resource rate or use a cost rate table. It creates a fixed cost that stays constant regardless of:
Task duration
Resource assignments
Escalation over time
Cost rate table logic
This might be acceptable in rare cases such as one-time fees. But if you do it regularly, especially for labor or materials, your cost model becomes disconnected from reality. You can’t track actuals. You can’t apply burdening or escalation. You lose all time-phased visibility.
Pro Tip:
If you’re not seeing your costs roll up as expected, or if they don’t match your rate assumptions, check for fixed costs hiding in plain sight.
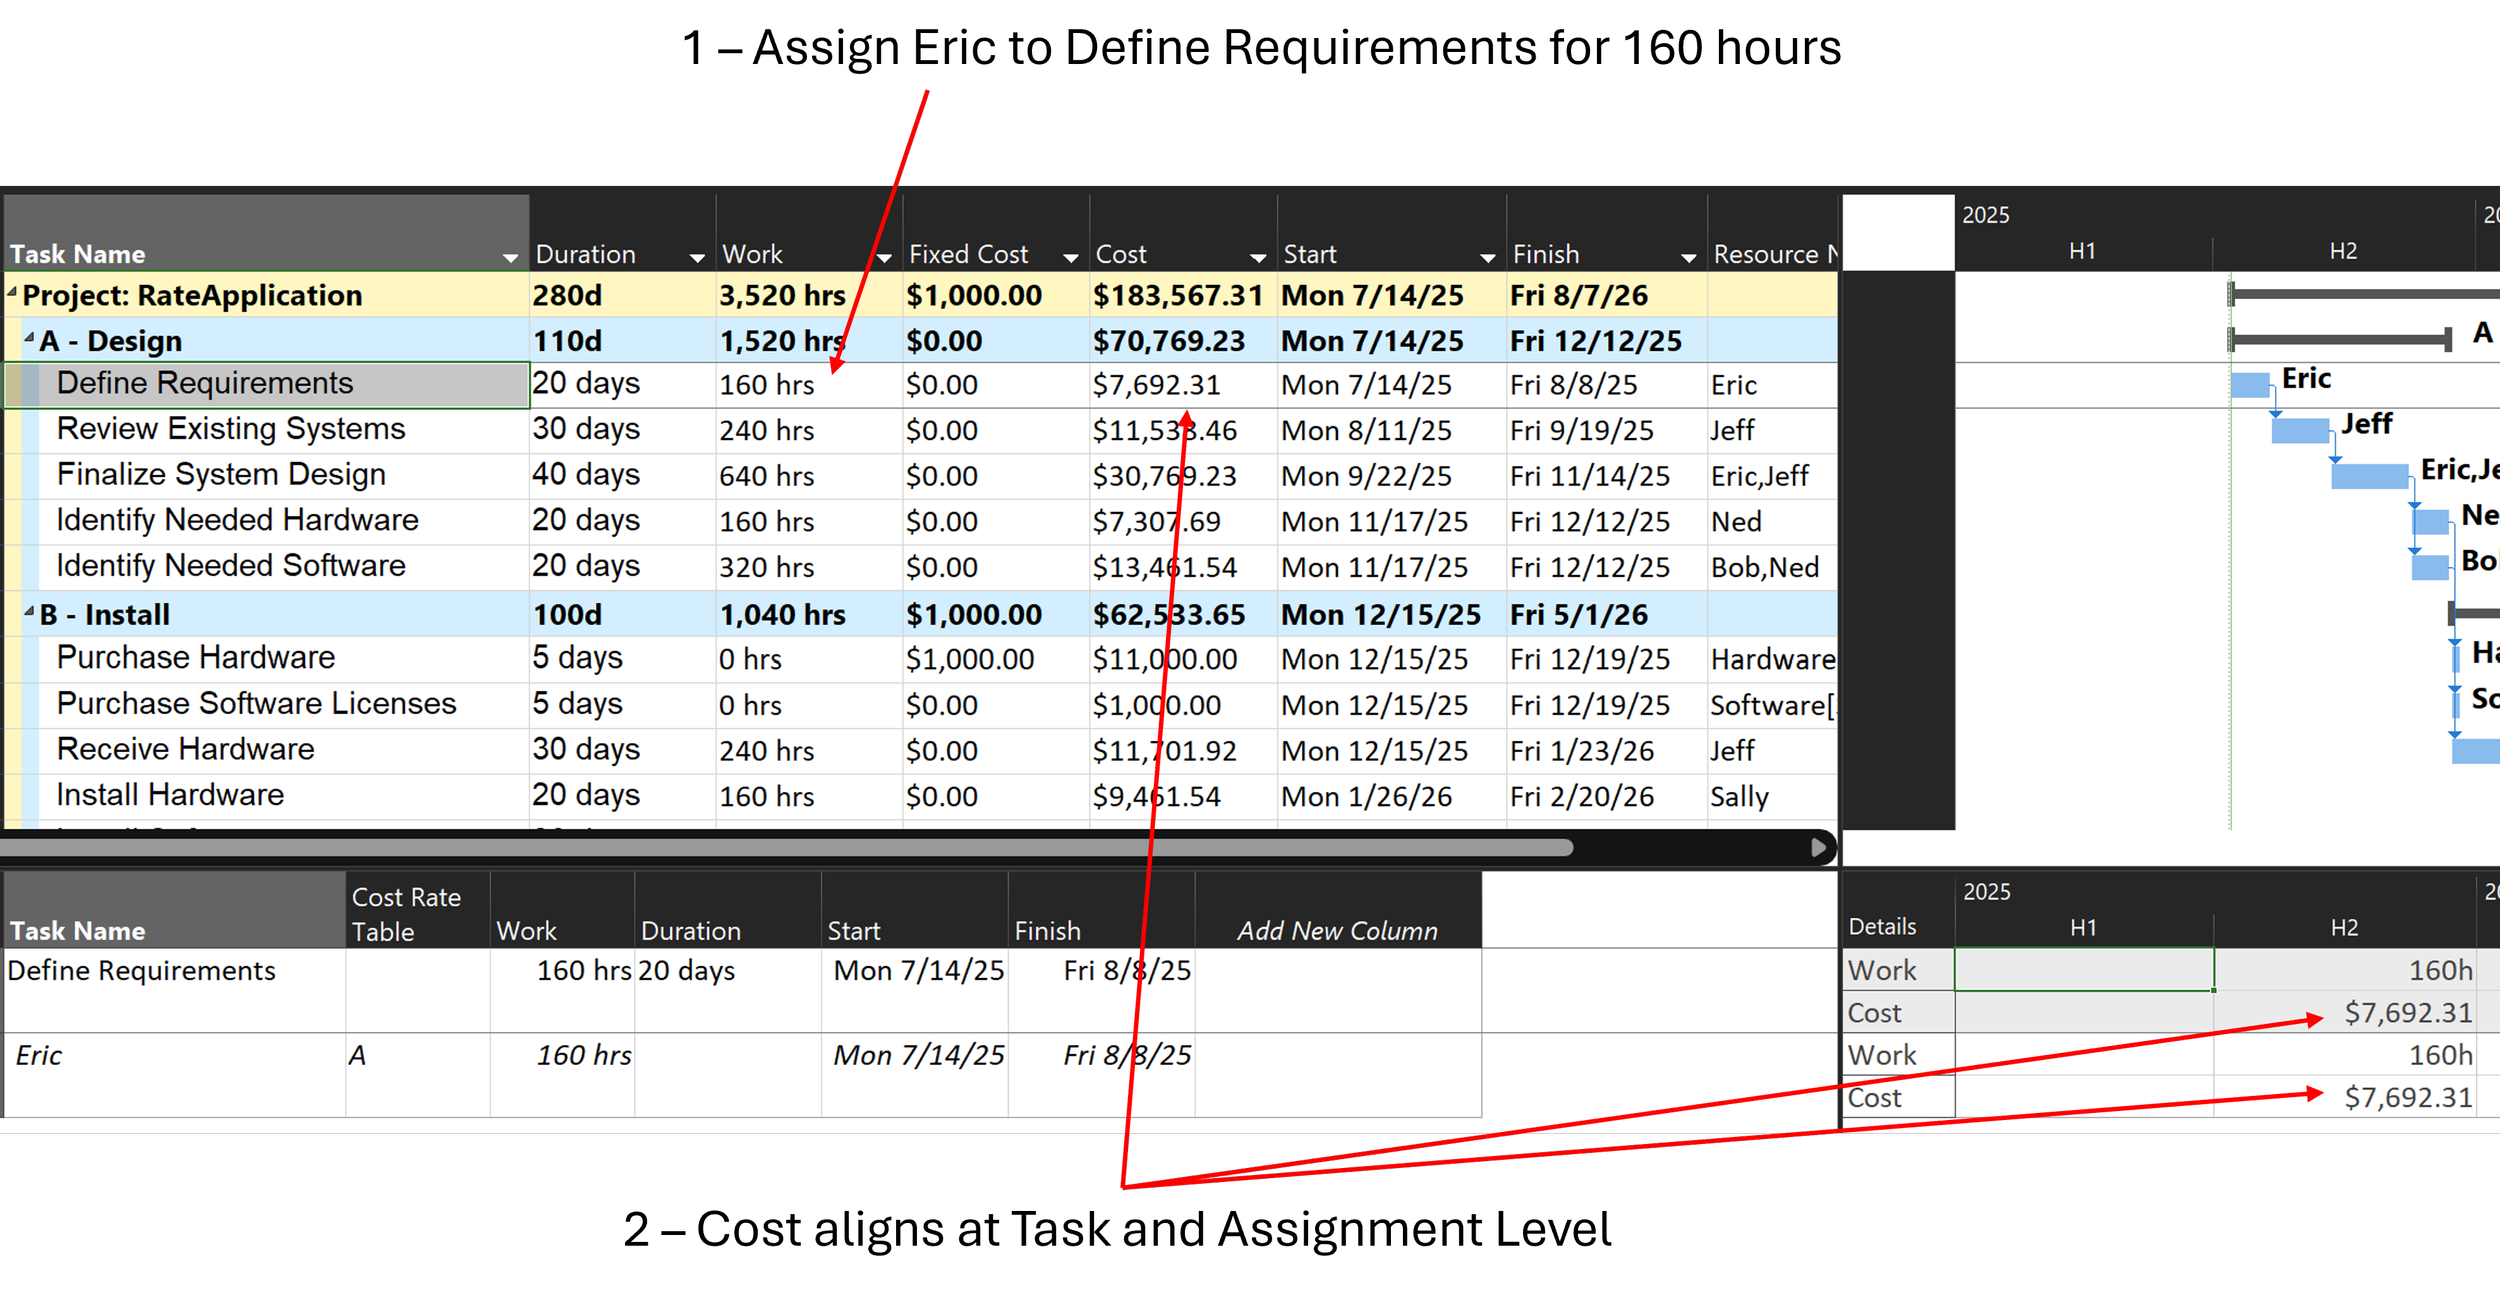
Calculated Assignment Cost from Rate Table A - Eric for 160 hours

Task Cost No Longer Equals Assignment Cost After Direct Edit of Cost Field on the Task
6. The Real Fix Using Cost Rate Tables as a Modeling Layer
Microsoft Project provides a feature that can solve these problems: cost rate tables. But very few users take advantage of it.
Each resource in Project supports five cost rate tables labeled A through E. Each table can define:
A standard hourly rate
An overtime rate
A per-use cost
Effective date ranges for escalation or phased rates
You can assign different rate tables to different tasks, or flip the rate table on the same task to show different cost views.
Table Use Case
A Direct labor only
B Fully burdened labor (OH, G&A)
C Burdened plus fee
D Labor only, no material
E Material only, no labor
This allows you to view the same schedule through different cost perspectives without exporting to Excel or altering task logic.
7. How Indirect Costs Really Work and Why the Break in MS Project
In many organizations, labor cost isn’t just about someone’s hourly rate. It’s about indirects, which are structured layers of additional cost that reflect the true expense of delivering labor. These typically include:
Fringe benefits (healthcare, leave, retirement contributions)
Overhead (facilities, supervision, systems)
G&A (corporate expenses)
Fee or profit (for proposals or commercial pricing)
A Realistic Example
Let’s say your schedule includes a salaried employee earning $100,000 per year. Based on a standard 2080 hours per year, that gives you a base hourly rate of:
$100,000 ÷ 2080 = $48.076923/hour
Now apply your organization’s indirect structure:
Fringe = 30% of base
Overhead = 60% of base + fringe
G&A = 10% of base
Fee = 5% applied to the fully burdened subtotal
Calculated Cost Buildup
Component Calculation Result
Base Rate - $48.076923
Fringe (30%) 48.076923 × 0.30 $14.423077
Overhead (60%) (48.076923 + 14.423077) × 0.60 $37.500000
G&A (10%) 48.076923 × 0.10 $4.807692
Subtotal Base + Fringe + OH + G&A $104.807692
Fee (5%) 104.807692 × 0.05 $5.240385
Total Subtotal + Fee $110.048077
This is your fully burdened, fee-inclusive hourly rate based on standard cost accounting rules.
Why MS Project Can’t Handle This Natively
Here’s where the problem starts:
MS Project only allows two decimal places in its UI
You can’t enter $110.048077, only $110.05 (rounded) or maybe $110.04 (truncated)
That means your cost model is now off by 0.002 to 0.008 cents per hour
That error multiplies fast over a real labor volume
The Reconciliation Problem at Scale
Now let’s say you have 250,000 labor hours planned across the schedule. Here’s how that small rounding gap plays out:
Rate Input Style Hourly Rate Total Cost Delta from True Value
Full precision (via VBA) $110.048077 $27,512,019.25 -
Manual entry (rounded) $110.05 $27,512,500.00 +$480.75
Manual entry (truncated) $110.04 $27,510,000.00 –$2,019.25
Simplified entry $110.00 $27,500,000.00 –$12,019.25
That difference might be the reason your baseline doesn’t reconcile with:
Proposal pricing tools like ProPricer
Internal EVM cost engines
Budget baselines in control systems
Audit thresholds for allowable cost variance
Why VBA Makes the Difference
The only way to load the full $110.048077 rate into MS Project is via VBA. VBA lets you bypass the UI’s rounding and directly populate precision rate information.
This preserves all decimals. No guessing. No error drift. And no explaining where those extra dollars came from during a review.
8. The Solution: VBA for Precision Cost Modeling, Excel for User Input
Here’s the approach:
Model your labor and material rates in Excel using full decimal precision
Use VBA to load them into MS Project and populate each rate table with the correct values and effective dates
Use macros to assign different rate tables to tasks depending on the cost perspective you want to model
This lets you instantly view and compare:
Direct labor
Fully burdened labor
Labor with fee
Material-only or labor-only cost scenarios
Escalated or time-phased costs for proposals or forecasts
You can also support internal-to-client overlays, pricing validations, and audit-prep scenarios all from within a single file.
9. Modeling Non-Labor Cost with Material Resources
To model costs such as materials, travel, or subcontractor charges, use the material resource trick.
Here’s how:
Define a material resource with a standard rate of $1 per unit
Assign it to a task using units equal to the dollar amount (e.g., 1,000 units = $1,000)
Apply escalation or burdening using the cost rate tables just like labor
This gives you complete cost tracking across both labor and non-labor elements inside the same schedule.
10. Real-Time Cost Comparisons Without Guesswork
Once your rate tables are loaded, you can:
Switch between cost perspectives in real time
Validate that costs match external pricing systems
Confirm escalation and burdening logic directly in the schedule
See cost impacts at the task, resource, and project level without manual recalculations
This is the difference between estimating and verifying.
You’re no longer guessing at the cost. You’re seeing it live.
11. Broad Use Cases Across Industries
Even if you aren’t using earned value or submitting formal proposals, this technique applies to any industry where:
Labor and material costs must be modeled and compared
Scenarios require cost overlays or forecasting adjustments
Teams need reconciliation between budget and plan
Cost confidence matters for stakeholders and reporting
Whether you’re in construction, IT, engineering, manufacturing, or consulting, this strategy adds rigor and flexibility to your planning.
12. Coming Soon Free Webinar and Downloadable Tools
This topic is the next installment in a monthly MPUG webinar series hosted by Eric and Jeff Christoph.
Last month, Eric presented "Resource Loading Like a Pro", showing how to solve tricky problems when resource assignments don’t align with task start and finish dates in Microsoft Project.
Now that your schedule is resource-loaded, the natural next step is to look at accurate cost modeling.
Join us on:
🗓 Wednesday, August 6
🕛 Noon Eastern
📍 Live on MPUG
In this session, you’ll get:
A full walkthrough of the Excel + VBA cost modeling method with bulk load capability
A simple ribbon to trigger macros for importing and exporting rates, and switching between applied cost rate tables
The .mpp file, rate import Excel file, and VBA macro used in this article
Tips for modeling direct, burdened, and fee-inclusive rates
Live Q&A and demo of rate switching and cost validation
Whether you’re building proposals, baselines, or just want your schedule to tell the whole financial story - this webinar will give you the tools.
🔗 https://mpug.com/event/from-dates-to-dollars-advanced-cost-modeling-in-ms-project/

13. Final Thoughts No More Rounding, No More Surprises
Project managers and schedulers need more than timelines. They need cost confidence.
This solution turns Microsoft Project into a real cost modeling platform. You can plan with precision, communicate with clarity, and support any downstream integration without leaving the tool you already use.
No more rounding. No more manual errors. No more explaining fixed costs that don’t make sense.
Just real, reliable numbers. From dates to dollars.