Dashboards and Reporting
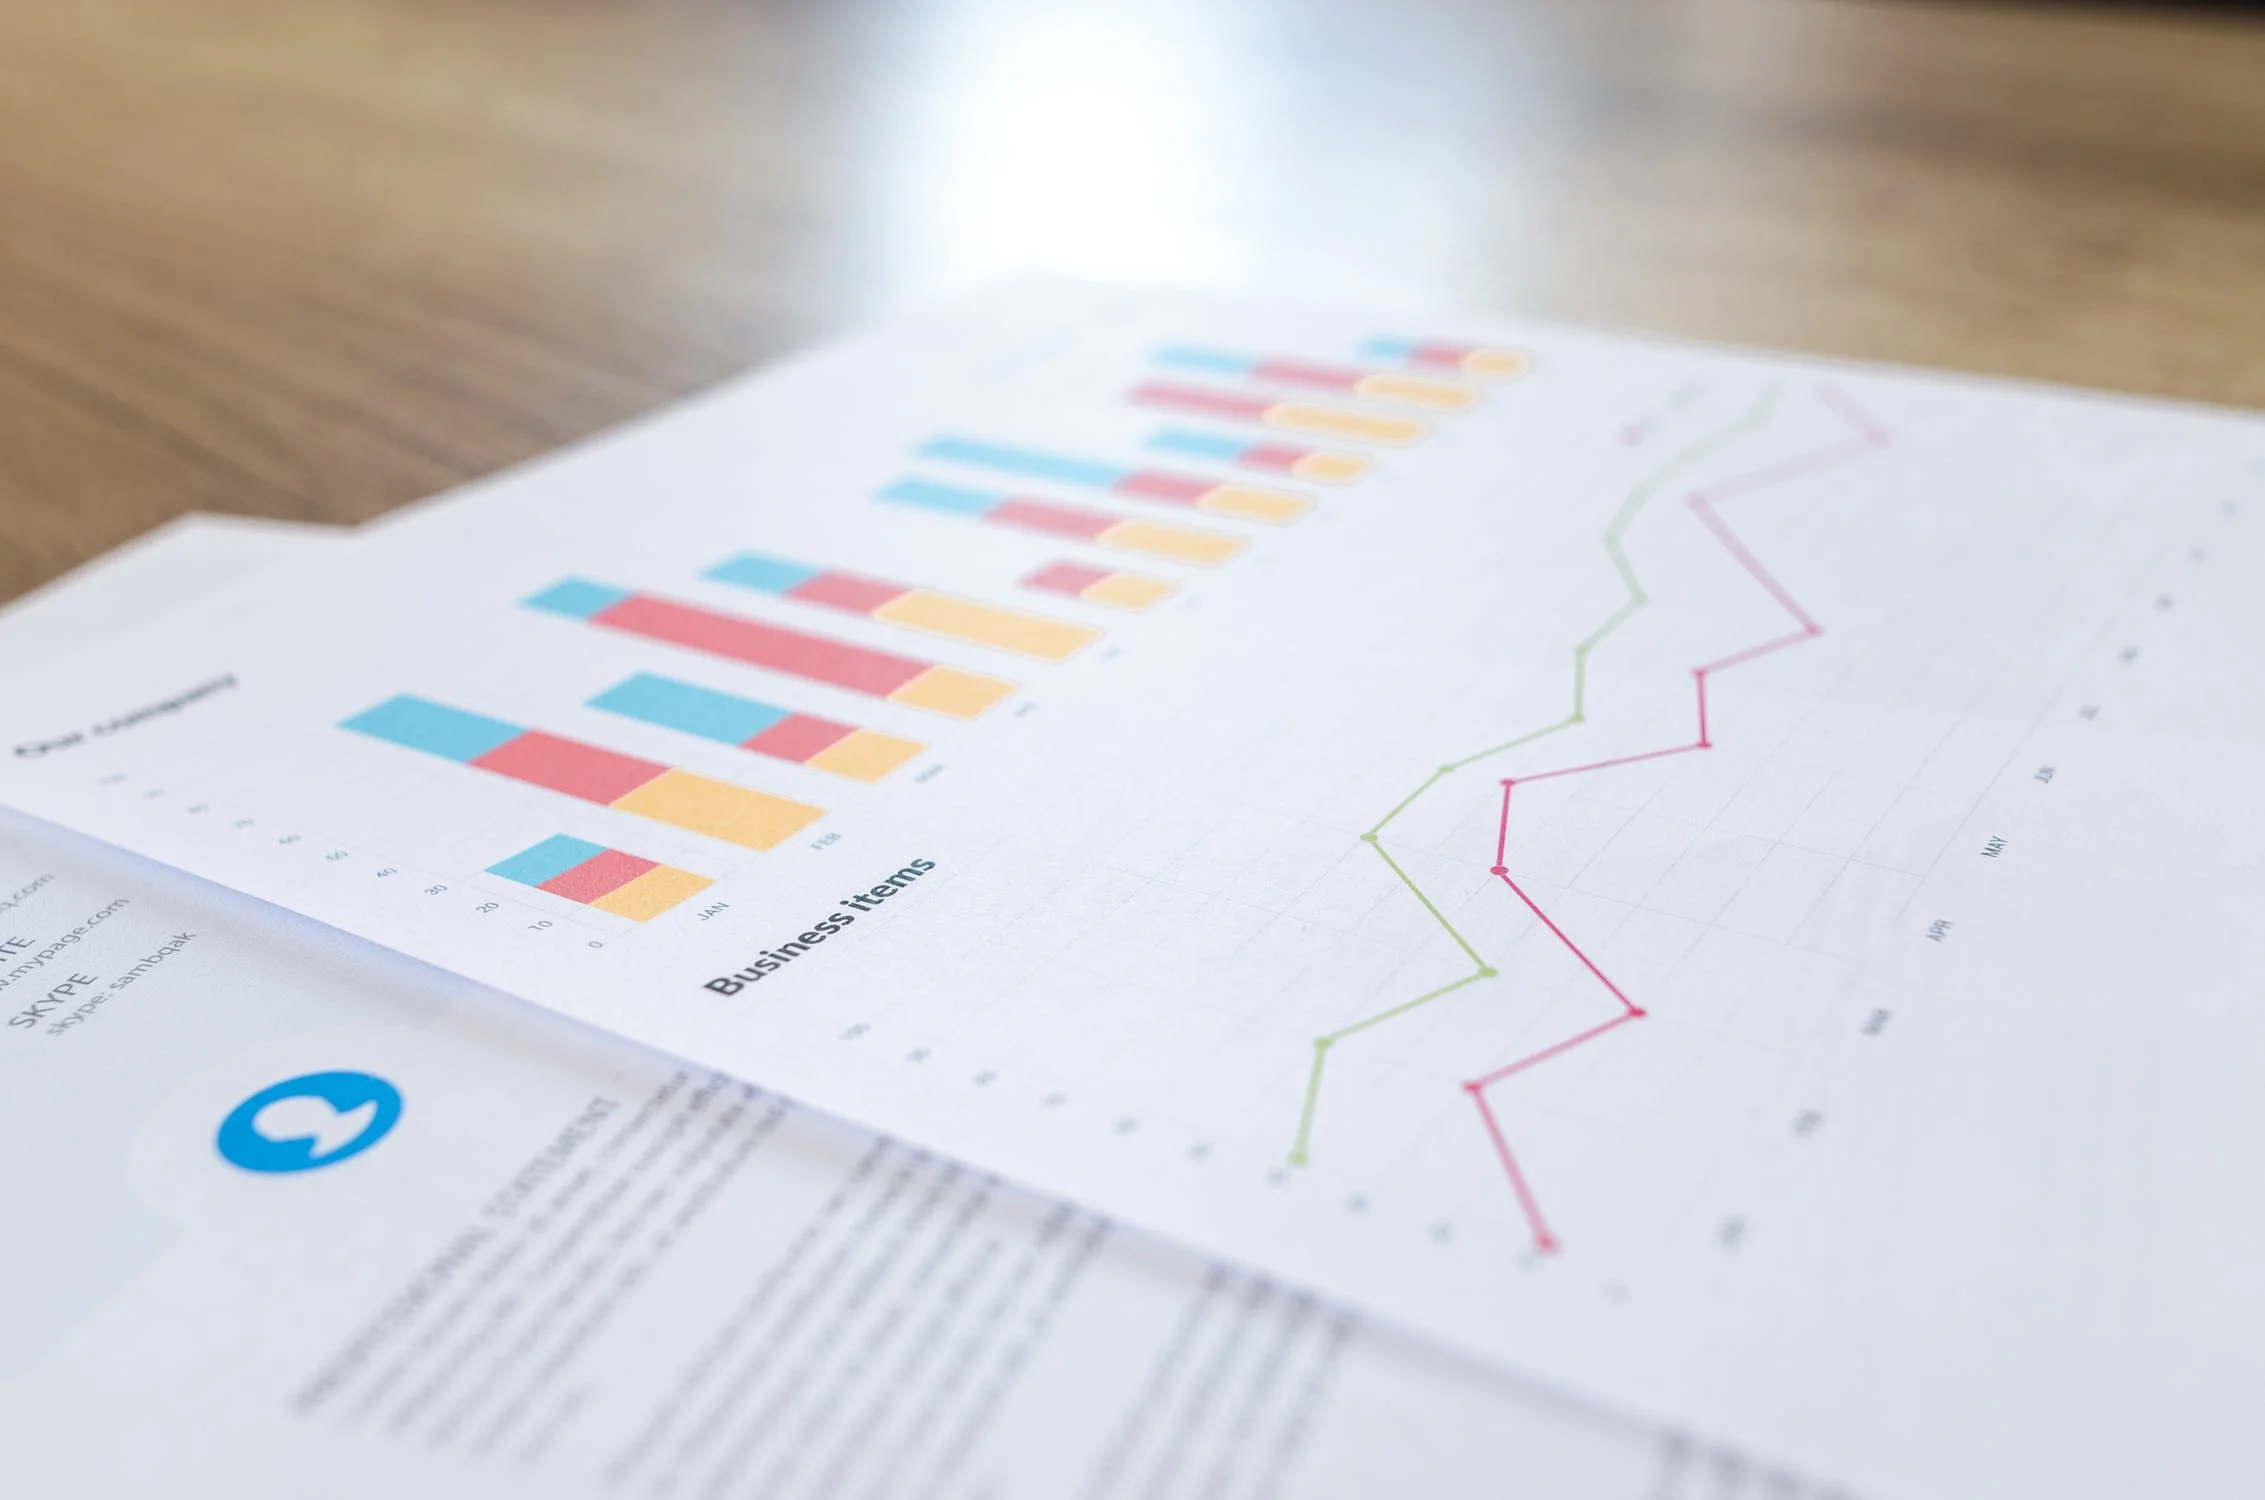
Dashboards and reports are canvases offered through Power BI that show visualizations for your data. Typically, a dashboard is a single page that draws from one or more data sources whereas a report contains multiple pages that explore a single dataset. These canvases show you in one concise location dynamic information about your data with visuals that update as the data changes.
TMS builds dashboards and reports that are designed to keep your schedule on track. We use a series of schedule health checks from the NDIA’s Planning & Scheduling Excellence Guide to show you the strength of your schedule and if anything is lagging behind. These checks allow you to gauge the performance of your schedule with ease, when a data model has been built. The dashboards and reports also provide a quick way to see data visualizations for multiple project schedules in one document.
